You've got ads running, content publishing, social posts going out, and maybe an email sequence or two in the background. The budget is spread out, the reports show activity everywhere, and yet the qualified calls feel thinner than they should. That pattern is common for small businesses and law firms, and it usually isn't a spending problem first. It's a prioritization problem.
Table of Contents
- Step 1 Define the Outcome Before You Rank Anything
- Step 2 Rank by Value Metrics Not Surface Metrics
- Step 3 Test Whether the Concentration Holds Over Time
- Customer Spend Tiers in a Wholesale Business
- Why a Fixed Cutoff Can Hide Your Actual Core
- Concentrated Visibility in AI Search
- Mistake 1 Ranking by Revenue When Profit Is the Point
- Mistake 2 Assuming the Remaining 80% Is Waste
- Mistake 3 Reallocating in One Big Move
Why Most Marketing Budgets Miss the Mark
A small firm splits its monthly budget evenly because that feels fair. Search gets a share, social gets a share, a directory listing gets renewed, and content gets whatever time is left. By month end, every channel can point to something, a few clicks here, some impressions there, but only one or two sources produced consultations that turned into signed work.
That's the trap of even allocation. It treats every input as if it carries equal weight, when your own results almost never behave that way. 80/20 rule marketing starts from the opposite assumption. You look for concentration first, then you decide where the next dollar earns its place.
The Budget That Looks Balanced on Paper
Even splits hide two problems. First, they fund channels based on habit or vendor pressure rather than downstream value. Second, they starve the winners. A campaign that's already producing qualified inquiries can't scale if it's capped at the same level as a channel that's only producing cheap, unqualified traffic.
If you're working out how to allocate marketing funds, the useful question isn't how to divide a pie neatly. It's which slice is already feeding the business. A practical review of what advertising on Google really costs makes the same point from the paid search side, because headline cost means little until you connect it to inquiry quality and signed revenue.
Practical rule: Don't ask which channel got the most leads. Ask which channel got the leads you'd happily pay to get again.
What Concentration Looks Like in Practice
- A few service pages carry most of your high intent calls, while dozens of blog posts add sessions but few consultations.
- A narrow set of search terms produces signed matters, while broad terms generate volume you end up screening out.
- A small referral group sends clients who close quickly and pay on time, while other sources need heavy follow up for little return.
None of that means the quieter assets are worthless. It means you can't manage them as equals. Most businesses already have a vital 20% sitting in their CRM, analytics, and billing records. They just haven't ranked it by the right outcome yet. The rule's job is to make you look, not to hand you an answer before you've checked.
Understanding the Pareto Principle
The idea traces back to Italian economist Vilfredo Pareto, who documented in 1906 that approximately 20% of Italy's population owned about 80% of the country's land and property. Pareto wasn't writing about advertising. He was describing an unequal distribution that kept appearing in economic outcomes.
Decades later, Joseph M. Juran formalized the concept for management and quality improvement in 1941, describing the small group of influential causes as the vital few versus the trivial many. That framing is why the idea survived outside economics. Managers could use it to decide which defects, customers, or inputs deserved attention first.
The visual below maps that relationship in its simplest form, a small share of inputs linked to a large share of outputs.

A Diagnostic Pattern Not a Fixed Law
In marketing, the principle usually gets stated as roughly 80% of an outcome tied to about 20% of the inputs, with common examples like approximately 80% of sales volume coming from 20% of customers and approximately 80% of revenue coming from 20% of products. The word roughly does real work there. It's a starting hypothesis for analysis, not an accounting identity your business must match.
The actual ratio shifts with market, offer, price point, and business model. A consultancy where three anchor clients fund the payroll will show a far steeper curve than a retailer processing thousands of similar-sized orders. Assuming exactly a fifth of your customers produce exactly four fifths of sales skips the only step that matters: calculating your own split.
How to Read the Principle as an Operator
Treat the rule as a sorting instruction. Rank customers by margin rather than revenue alone, because a high-spending account with heavy service costs can rank below a smaller one that pays full price and renews. Sort products or practice areas by contribution, campaigns by qualified inquiries, and channels by downstream revenue. Then check whether a small segment produces a disproportionate share.
If it does, you've found where incremental effort is most likely to pay back. If it doesn't, you've learned something equally useful: your growth problem isn't concentration, and slashing the long tail would cut tomorrow's pipeline along with today's clutter. Either way, the principle earns its keep by forcing a measurement you'd otherwise postpone.
What the Research Actually Shows
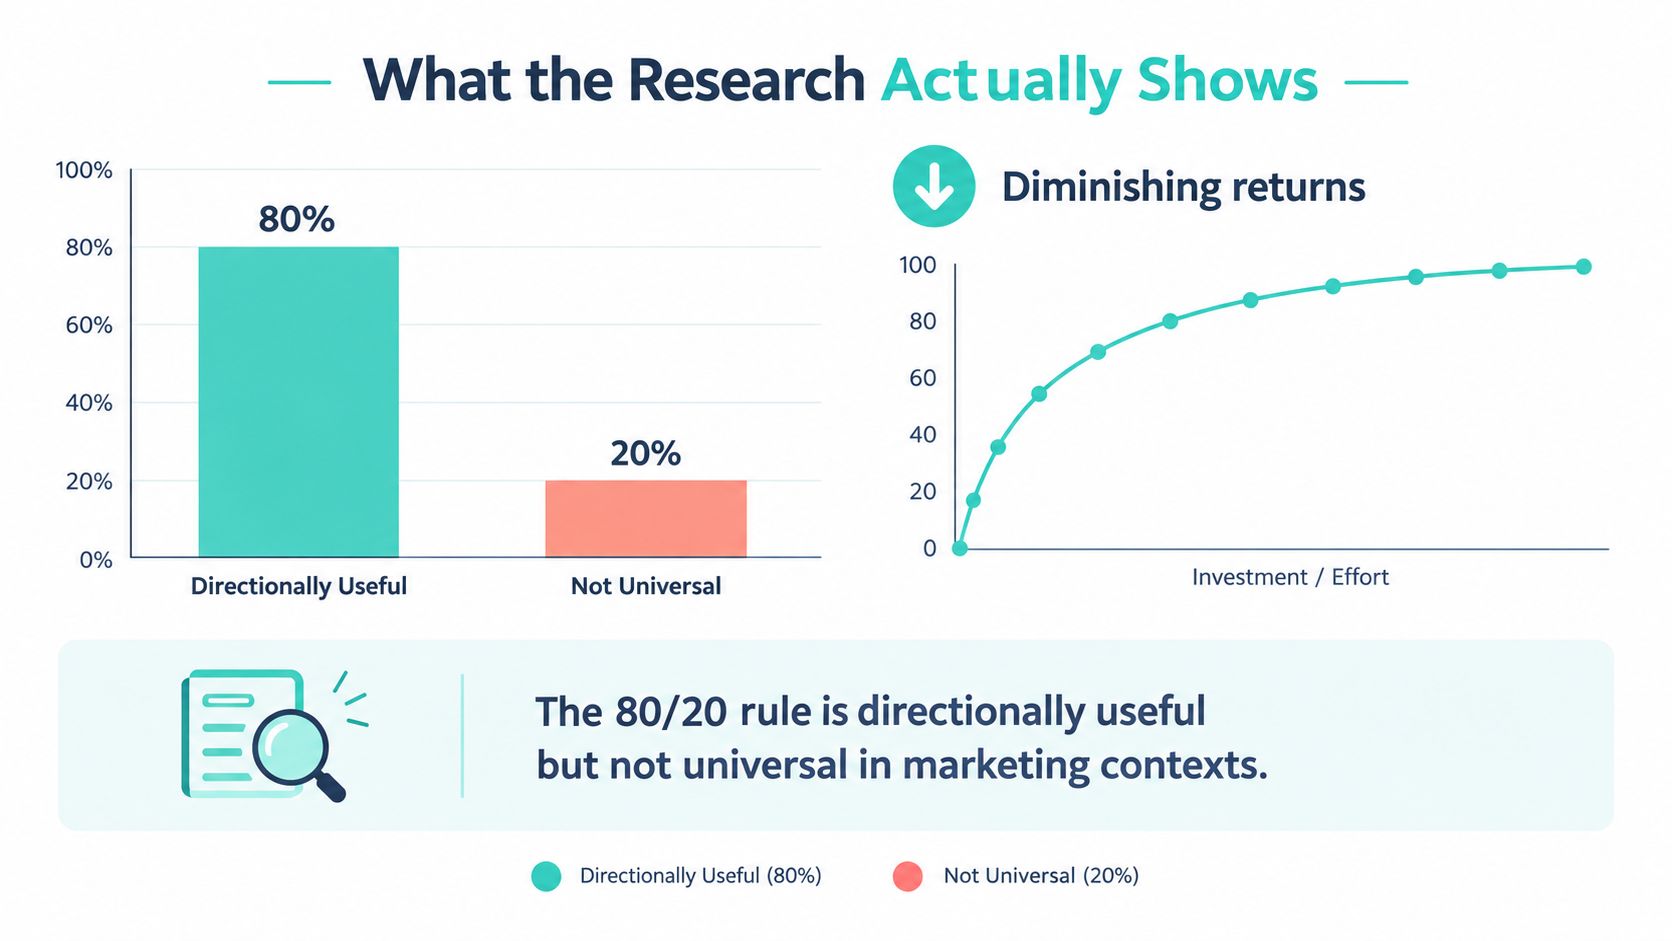
Modern studies support the direction of the rule and undermine the exact numbers. That is a healthier place to start than the slogan version, because it tells you to expect imbalance without promising its size.
A study of 22 consumer packaged goods categories reported an average Pareto ratio of 0.73, meaning the top 20% of customers generated approximately 73% of sales. Close to the classic formulation, but not identical to it. If you had budgeted on a perfect split, you would have overstated how much your best customers carry.
The chart below summarizes that tension between a useful pattern and an unreliable exact ratio.
Business Model Changes the Split
A later study covering 339 publicly traded non consumer packaged goods companies found an overall average ratio of 0.67, with product companies at 0.67 and service companies at 0.66. The sharper finding sits inside that average. The same study reported non subscription companies at 0.68 while subscription businesses averaged 0.59, so in recurring revenue models the top fifth of customers produced closer to three fifths of sales than four fifths.
That gap makes intuitive sense once you look at pricing structure. Recurring fees compress the distance between your best and typical customer, especially when packages are tiered and churn is managed. Transactional and project based businesses run lumpier revenue, so a few large buyers can dominate a period. Neither pattern is healthier by default. They demand different decisions about where your attention goes.
| Business Type | Average Pareto Ratio | What It Suggests |
|---|---|---|
| Consumer packaged goods categories | 0.73 | Concentration is strong but below the classic split |
| Non subscription companies | 0.68 | Top customers matter heavily, revenue stays lumpier |
| Subscription businesses | 0.59 | Revenue is more evenly spread across the base |
Ratios in this table come from the Springer study cited above.
What This Means for Your Own Numbers
If you run a recurring revenue model, resist hunting for a tiny elite while ignoring the broad middle that sustains you. If you run a practice where a few matter types produce most collected fees, stop treating every inquiry as equal. Measure concentration with metrics that match your model: gross profit, recurring revenue, retention, and qualified leads generated.
Basic funnel math does the rest. A working grasp of how to calculate a conversion rate keeps you from ranking sources on raw inquiry volume, because a channel with fewer inquiries and a stronger qualified rate can be your real top segment even when a noisier channel wins the lead count every month.
How to Identify Your Vital 20%
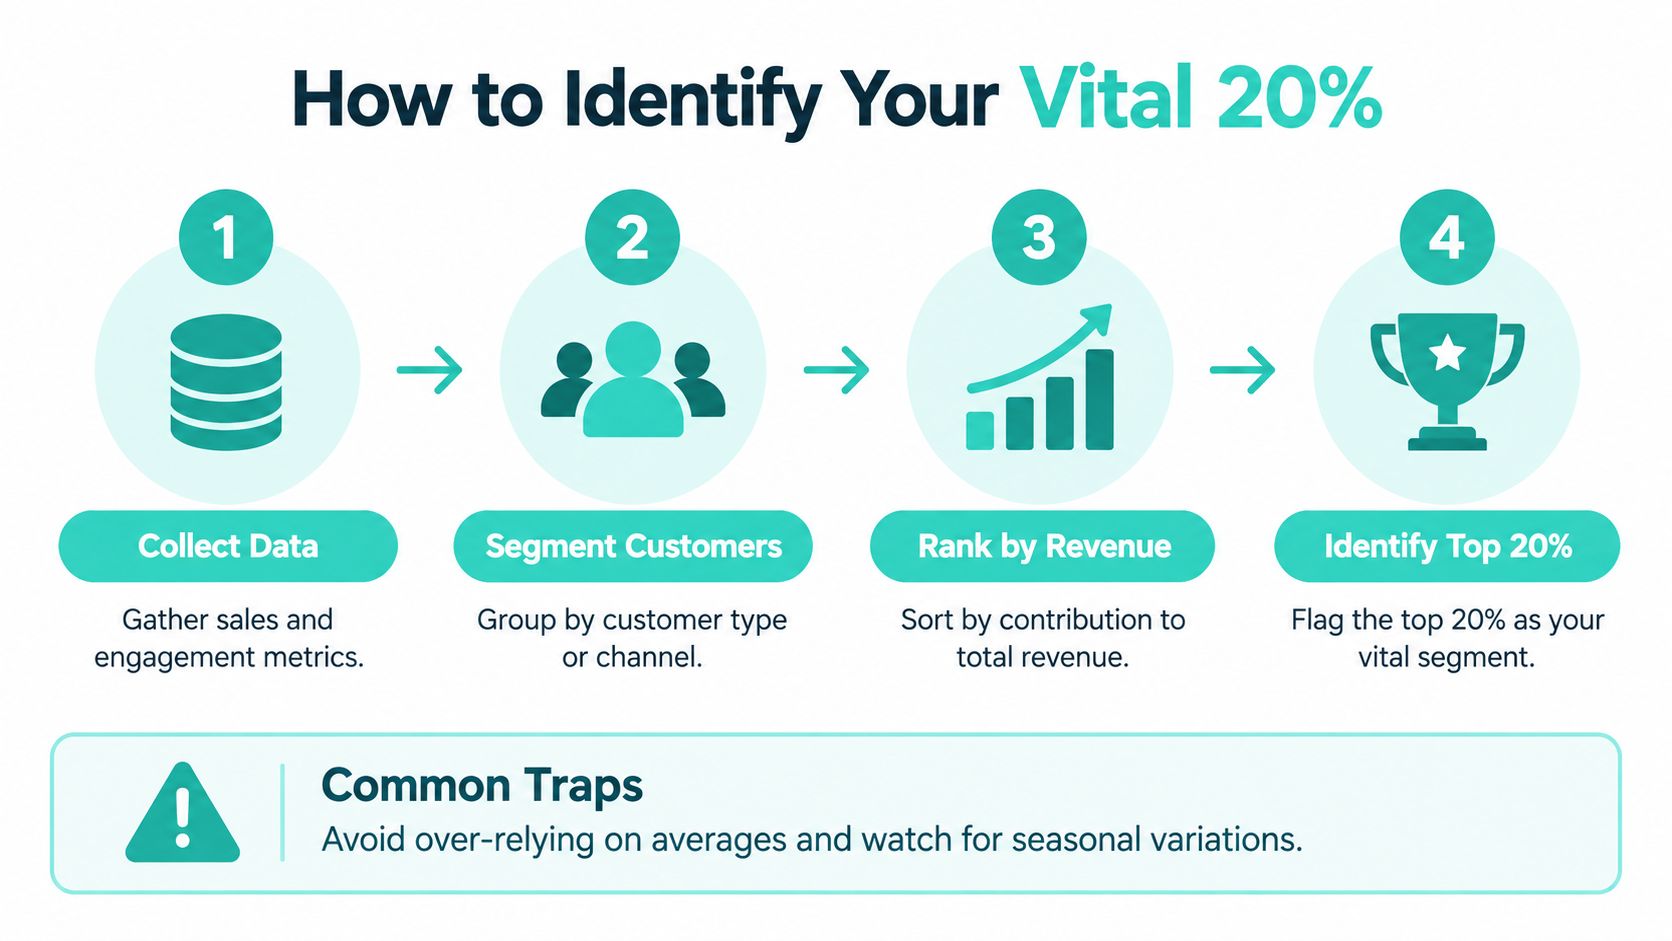
Most guides stop at telling you to find your best customers and channels. The hard part is defining best without fooling yourself. A source can generate plenty of inquiries and still produce few qualified opportunities, while a smaller source sends the cases or buyers who pay.
The flow below shows the basic sequence, collect, segment, rank, then flag the top group.
Step 1 Define the Outcome Before You Rank Anything
Pick one primary outcome per analysis. Revenue, gross margin, qualified inquiries, booked consultations, signed engagements, and customer lifetime value will each produce a different top group. Google's customer lifetime value guidance recommends building on first party customer data to understand current high value customers, and it presents the pattern conditionally, as something that may hold for a business rather than something that must.
Export customer level records for a defined period. For search performance history that extends beyond what the standard interface keeps handy, you can export GSC history with Month17 so older query and page trends aren't lost when you compare periods. Then sort customers or sources from highest to lowest value and calculate cumulative contribution as you move down the list.
Step 2 Rank by Value Metrics Not Surface Metrics
Build your ranking from measures that survive contact with the sales process.
- Qualified lead rate: The share of inquiries that fit your service, geography, budget, and timing criteria.
- Close rate: How often those qualified inquiries become signed or paying customers.
- Customer value and margin: Collected revenue minus delivery, discounting, and service costs.
- Payback period: How long acquisition cost takes to recover from that segment.
Separate branded demand from incremental demand while you do this. Branded search often looks like a superstar because it's harvesting people who already decided to contact you. That's valuable, but it doesn't prove the channel creates new demand. For paid search specifically, a disciplined review using the Google Ads search terms report helps you see which actual queries produced qualified actions, not just which campaigns collected clicks.
The short walkthrough below reinforces how to think through that ranking before you move budget.
Step 3 Test Whether the Concentration Holds Over Time
Run the same ranking across more than one period. Seasonality, budget changes, platform auctions, and small sample sizes can make a channel look dominant for a month and ordinary the next. A vital segment that survives several periods deserves more investment. A spike deserves a question first.
Don't promote a channel to vital status on one strong month. Make it earn that label across periods that include slow weeks too.
Real-World Examples of Concentrated Value
A documented three year analysis of 27,649 orders from an Australian wholesale business found a distribution far more concentrated than the shorthand suggests, with 4.2% of customers generating 69.6% of total revenue. If that business had only looked for a top fifth, it would have blurred the decisive group into a much larger bucket.
The tier breakdown shows where the weight sat.
Customer Spend Tiers in a Wholesale Business
| Tier | Customers | Share of Base | Share of Revenue |
|---|---|---|---|
| Whale | 364 | 4.2% | 69.6% |
| VIP | 820 | 9.5% | 17.5% |
| Combined top two tiers | 1,184 | 13.7% | 87.1% |
Tier figures from the same order analysis.
Why a Fixed Cutoff Can Hide Your Actual Core
Together those two tiers represented 13.7% of customers but 87.1% of revenue, based on the same wholesale customer tier analysis. The lesson here: an automatic cutoff can conceal a smaller core, or invent one where the distribution is flat. I've seen this same exercise produce curves far flatter than the shorthand predicts, which is exactly why the threshold testing matters.
Test multiple cumulative thresholds instead of stopping at a single line. Compare the top 5%, 10%, 20%, and 25% on revenue, gross margin, repeat rate, and retention. Then ask what those customers share, which offer they bought first, which source introduced them, and how much service effort they require. That profile becomes usable for targeting, retention, and offer design. It also pairs well with knowing how to calculate break even ROAS the right way, because a high revenue tier only deserves more spend if it clears your margin floor after acquisition cost.
Concentrated Visibility in AI Search
The same logic now applies to search visibility. Semrush tracking reported that Google AI Overviews appeared on 6.49% of tracked keywords in January 2025, rose to nearly 25% in July, and fell to 15.69% in November. That volatility means a small set of authoritative service pages, FAQs, local proof points, and original data may carry outsized weight when engines answer directly.
Separate reporting on Pew Research Center browsing data found that users clicked a traditional result in 8% of visits when an AI summary appeared, compared with 15% when it did not, per the same reporting. Before you abandon organic work, note the counterpoint in that coverage: zero click rates for the same keywords declined from 33.75% to 31.53% after Overviews appeared. Concentrate on conversion ready assets and judge them by qualified calls, form submissions, and branded searches rather than raw sessions.
Common Mistakes to Avoid
The most expensive mistake is treating the principle as guaranteed mathematics. A review summarized by IFLScience reports that studies attempting to verify the rule have often found it inaccurate, while still noting it can help identify a small core associated with stronger profit opportunities, a caution echoed in Google guidance presenting the 80/20 relationship as conditional on first party data. Use it to generate a hypothesis, then verify with your own records.
Mistake 1 Ranking by Revenue When Profit Is the Point
A segment can produce most of your gross revenue and far less of your profit if it demands heavy discounts, senior staff time, or constant hand holding. The opposite mistake happens too. A campaign producing a modest share of leads can generate most closed revenue because its inquiries arrive better qualified. If you rank on the wrong outcome, you'll fund the wrong winner with great confidence.
- Define the outcome first: Revenue, profit, qualified leads, or lifetime value each crown a different top group.
- State the time window: A segment that leads over a quarter may trail over a year.
- Include acquisition cost: Contribution after spend is the number that should drive reallocation.
Mistake 2 Assuming the Remaining 80% Is Waste
80/20 rule marketing gets misused most often when teams cut experimental channels because current volume is low, then wonder why future demand dries up. Some activity builds familiarity, branded search, and referral readiness long before it shows up as a last click conversion. Cutting it can make this quarter cleaner and next year harder.
The long tail isn't automatically waste. Sometimes it's next year's vital few in an immature form.
Mistake 3 Reallocating in One Big Move
Don't swing the whole budget on a single analysis. Measure concentration, identify profitable contributors, and reallocate incrementally while watching the full funnel. Small shifts let you catch unintended effects, like a supposed weak channel that was assisting your best one. Big swings turn a diagnostic tool into a gamble.
Building a Prioritization Framework That Works
Profit concentration can run even sharper than revenue concentration. An MIT Sloan Management Review analysis of two company databases found that the top 20% of customers produced more than 90% of profits. The same analysis found a high customer lifetime value customer was worth about 25 times as much as a medium or low value customer. Margin asymmetry drives the gap. Some customers buy repeatedly, need little support, and send referrals your way, while others turn unprofitable once acquisition, service, and discounting costs are counted.
Build a Closed Loop Before You Move Budget
Connect each stage in one view so a source can't look good by stopping the story early.
- Ad source and landing page: Record where the inquiry started and which page converted it.
- Consultation quality: Score fit at intake, not weeks later from memory.
- Signed engagement and collected revenue: Track cash collected, not just proposals sent.
- Gross margin and retention: Close the loop by customer or matter type so value survives delivery costs.
With that loop in place, differentiated paths become practical. High propensity, high lifetime value segments get higher touch sales follow up and remarketing. Uncertain or low margin leads get lower cost automated nurture until they prove intent. A thoughtful channel strategy in marketing supports this by assigning each channel a defined job in the system rather than asking every channel to close deals directly. For paid media planning, that discipline pairs naturally with a structured approach to pay per click for small businesses, where budgets follow proven intent instead of spreading across every available placement.
Recalculate on a Fixed Cadence
The benchmark is never that exactly a fifth must produce four fifths. It's that a small profitable cohort can justify most of your incremental budget, and that cohort moves. Lead quality shifts, channel costs change, case mix evolves, and customer behavior drifts. I've watched a top ranked segment decay inside two quarters because bids rose and service costs crept up while nobody was looking.
Recalculate monthly or quarterly, and reserve part of the budget for testing what could become the next high value segment. That's the framework. Measure consistently, prioritize the proven few, and protect enough experimentation to keep future growth alive.
If your budget is spread across channels but you can't say which ones produce qualified inquiries and collected revenue, SimpleLab Digital can build that closed loop view and run the paid media, landing pages, content, and follow up behind it. Our subscription based team works with small businesses and law firms to find the few worth scaling and cut the spend that only looks busy. Visit SimpleLab Digital to see how a monthly plan would prioritize your marketing around measurable value.