A conversion rate is the percentage of eligible interactions that produce a defined desired action, calculated as (conversions ÷ total eligible interactions) × 100. The action and the denominator have to be named first, or the percentage doesn't tell you much at all.
You've probably seen two dashboards in the same week and wondered why one says the campaign is strong while the other looks mediocre. That happens because conversion rate is a business question wearing a math formula, and the answer changes when the event, the audience, or the denominator changes.
Table of Contents
- Start with the action you're counting
- Work the formula with the right denominator
- Why two correct answers can still differ
The Core Definition Behind Every Conversion Rate
A founder opens one report and sees a healthy percentage. A partner opens another and sees a different one. Both can be right.
That is why conversion rate needs a clear definition before anyone treats it like a verdict. It is a ratio that measures how often a defined action happens among a defined group of eligible interactions, and the label matters as much as the number itself. Google Ads gives a simple example, where 50 conversions from 1,000 ad interactions equal a 5% conversion rate because 50 ÷ 1,000 = 0.05 (Google Ads conversion rate definition).
The math is simple, the interpretation isn't
The core formula is:
conversion rate = (number of conversions ÷ total eligible interactions) × 100
The formula stays the same, but the meaning changes with the action you choose. A conversion can be a purchase, a lead-form submission, a phone-call click, a consultation booking, a newsletter signup, or another measurable action, and each one tells a different story (Google Ads conversion rate definition). A page with lots of form fills can still be weak if those inquiries are low quality.
Practical rule: never talk about a conversion rate unless you also name the conversion event and the denominator.
That matters because the rate answers a business question, not just a traffic question. It shows whether the marketing produced the outcome you wanted, not just whether people arrived. For a useful companion to that idea, see conversion rate optimization basics.
Same term, different denominators
The denominator can be ad clicks, sessions, or users, and that choice changes the result. Google Analytics 4 distinguishes session conversion rate from user conversion rate, so the same campaign can look different depending on whether you are measuring visits or people (Google Analytics conversion rate definition; Cardinal Path visual glossary).
| Denominator | Numerator | Example |
|---|---|---|
| Ad clicks | Conversions | Paid search report showing conversions divided by clicks |
| Sessions | Sessions with a conversion event | Website analytics report showing visit efficiency |
| Users | Users who converted at least once | Audience-level reporting that follows people across visits |
That is why two dashboards can disagree without either one being wrong. One may be asking, “How efficient were the visits?” while the other asks, “How many people converted at least once?” Once you see that distinction, the number stops being mysterious and starts being useful.
How to Calculate Conversion Rate Step by Step
A conversion rate only makes sense when you know exactly what went into it. The same percentage can point to very different outcomes if the report counts clicks, sessions, or users, so the first job is to set the denominator before anyone starts reading the number as a verdict.
Start with the action you're counting
Pick one outcome and keep it consistent for that report. In paid search, Google Ads may measure conversions against ad interactions, while website analytics may measure them against sessions or users, so the same campaign can produce different rates (Google Ads conversion rate definition; Google Analytics conversion rate definition). That is a measurement choice, not a mistake.
A simple way to frame it is this. The ad platform asks whether the click led to the action, while the website report asks whether the visit led to the action. Those questions overlap, but they are not identical.
| Scenario | Numerator | Denominator | Rate |
|---|---|---|---|
| Paid search campaign | Conversions | Ad clicks | Conversions ÷ clicks × 100 |
| Website report | Conversions | Sessions | Conversions ÷ sessions × 100 |
Work the formula with the right denominator
Google Ads gives a plain example. Fifty conversions from 1,000 ad interactions equals 5%, because 50 ÷ 1,000 = 0.05 (Google Ads conversion rate definition). The same math applies everywhere, but the denominator changes what the percentage means.
Google Analytics treats clicks and sessions differently because a browser can keep a visit alive within the measurement window, so two ad clicks do not always become two sessions (Google Analytics conversion rate definition). A click-based report and a session-based report can therefore disagree while both remain valid.
A conversion rate only matters when the report makes the conversion event, the eligible traffic, and the duplicate-handling rules clear.
That is why useful reports name more than one thing. They spell out the event, the attribution window, the date range, and the denominator. If you are reviewing a store or service funnel and trying to find where people drop out, fix conversion issues with Securify is a practical example of how businesses approach the problem.
Why two correct answers can still differ
A business may see one conversion rate in a paid media report and another in site analytics, and both can be right. One is tied to ad clicks, the other to website sessions or users, so the scope is different.
Instead of hunting for one magic percentage, label each rate so everyone knows what it measures.
Micro Conversions and Macro Conversions Explained
A dashboard that mixes every click, form open, and booked meeting into one number usually hides more than it reveals. Separate micro conversions from macro conversions and read them as early signals on the way to the main outcome, not as interchangeable wins.
Treat early signals as support, not the finish line
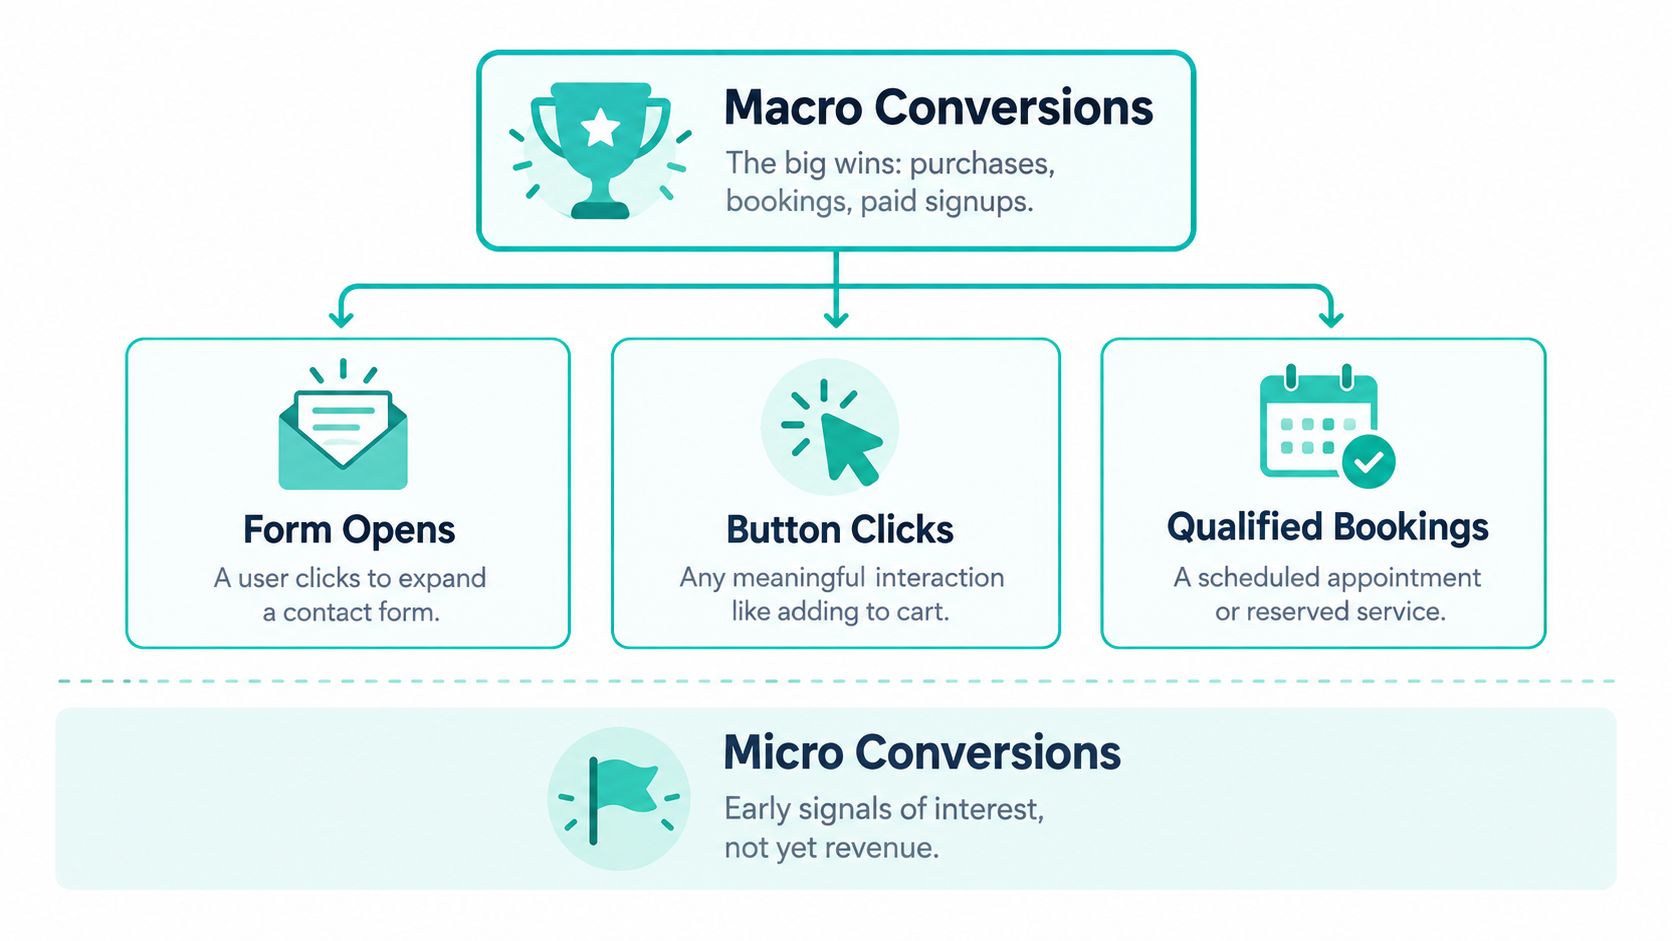
A micro conversion is a smaller action that suggests interest, but it does not yet represent the main business result. A macro conversion is the larger outcome, such as a purchase, booking, or paid signup. The distinction matters because the event you choose shapes the story the report tells.
A sales process works the same way. Someone who opens your contact form has shown intent, but that person is still a step away from a consultation or sale. For a marketer, those early actions matter because they show movement, yet they should stay in their own lane.
| Funnel Stage | Example Action | Counts As |
|---|---|---|
| Early interest | Form opens | Micro conversion |
| Engagement | Button clicks | Micro conversion |
| Commitment | Qualified bookings | Macro conversion |
Why mixing them distorts the headline rate
When micro and macro events are blended, the headline rate can look healthier than the business result. That often pushes teams to celebrate activity instead of outcomes. For small businesses and law firms, that matters because a page full of low-intent clicks can look busy while qualified inquiries stay flat.
The cleaner approach is to track supporting signals separately. Newsletter signups, downloads, and chat starts help you read interest, but they should not replace booked consultations or closed sales in the main performance report. If you need a concrete example of how lead paths can stay compliant in regulated advertising, Facebook advertising for attorneys that stays bar-compliant shows the kind of caution that matters.
Useful habit: count the early action as a step, not a victory.
That keeps optimization honest. A campaign can lift micro conversions and still underperform commercially if the leads are not qualified or do not move down the funnel.
Benchmarks That Travel and Benchmarks That Mislead
People want one simple answer to a fair question, “Is my conversion rate good?” The honest answer is that context changes everything.
Audience intent changes the meaning of the percentage
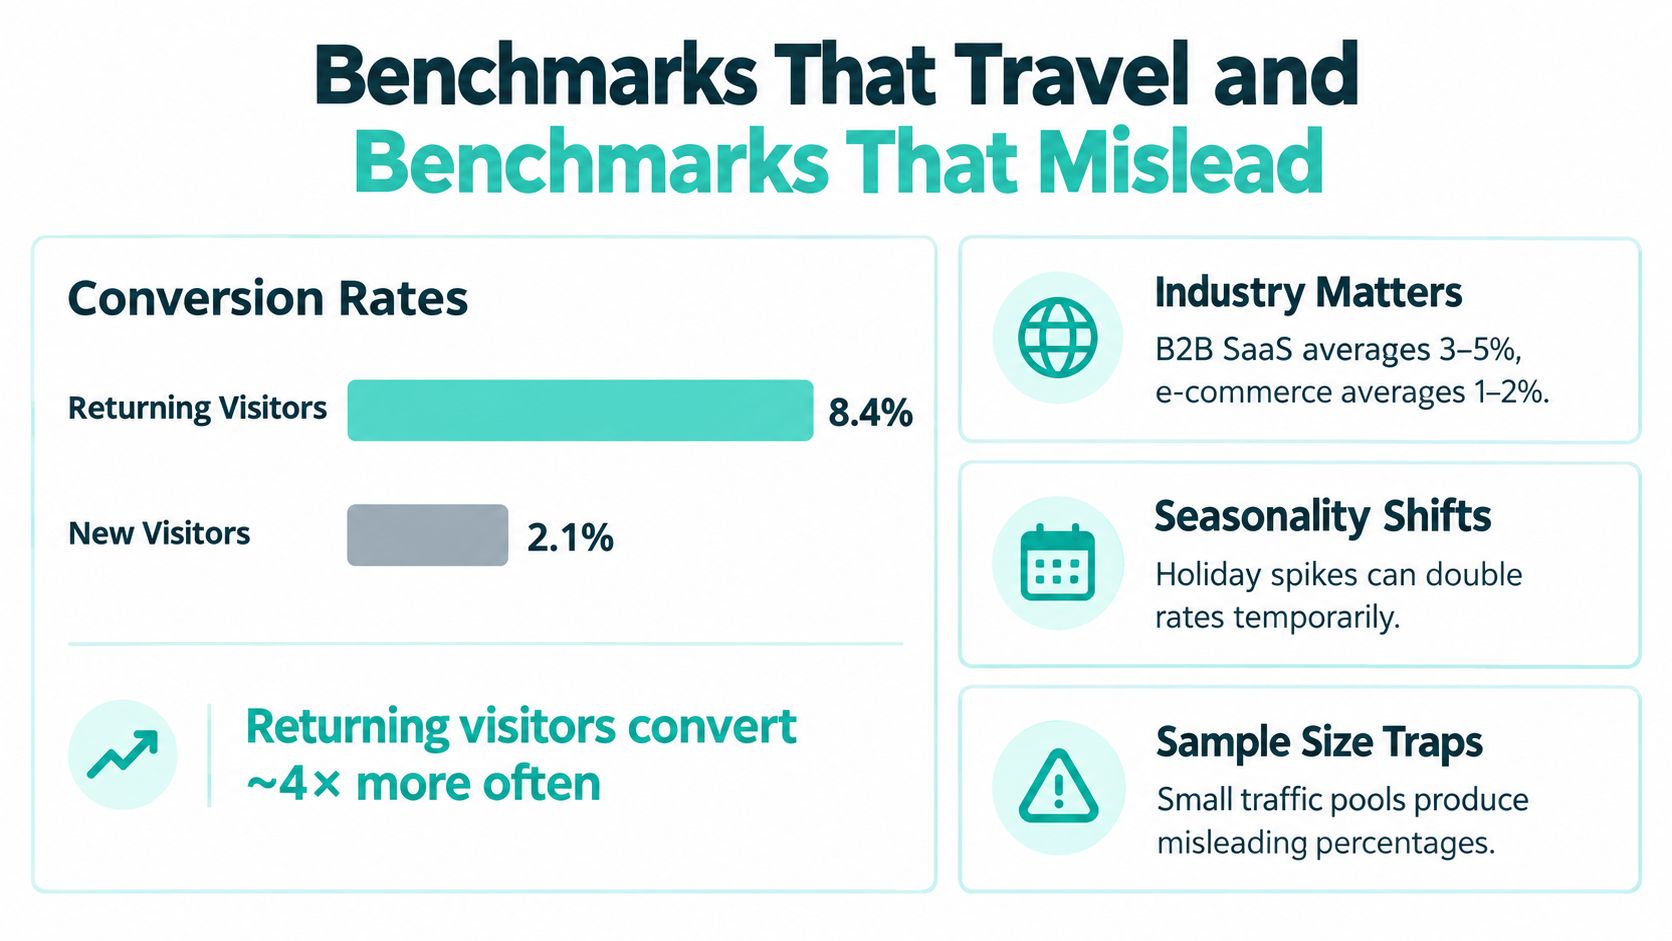
A returning visitor is usually not the same as a first-time visitor. Benchmark context shows that returning visitors convert about 1.8 times as often as new visitors, and desktop converts roughly 1.25 times as often as mobile across the cited test dataset (ConversionTeam benchmark context). The same page can look strong in one audience and weak in another.
Page type changes the benchmark too. A checkout page is not a homepage. Baymard's checkout research reports a global average cart-abandonment rate of 70.19%, which shows how different cart-stage behavior is from sitewide browsing behavior (Baymard checkout usability research). A checkout page works with a much hotter denominator than a homepage or product page, so the number has to be read in that context.
Benchmark the segment, not the whole mix
A useful benchmark is one you can act on. Compare mobile to mobile, new visitors to new visitors, and checkout behavior to checkout behavior. A broad average is a starting point, not a verdict.
| Segment | Typical Range | What Drives It |
|---|---|---|
| Returning visitors | Higher than new visitors | Familiarity and prior intent |
| New visitors | Lower than returning visitors | More trust and education needed |
| Checkout pages | Much higher than homepages | Users are already close to purchase |
That is why a low number on mobile does not automatically mean the mobile experience is broken. The audience may be researching now and converting later by phone or on another device. Device, source, and landing page all shape the final reading. If you are testing paid traffic, pay-per-click for small businesses a practical guide is a useful reminder that channel context comes before judgment.
A benchmark only helps when the comparison is fair. Compare like with like, then decide whether the rate reflects real performance or just a different mix of visitors.
Connecting Conversion Rate to Revenue and ROMI
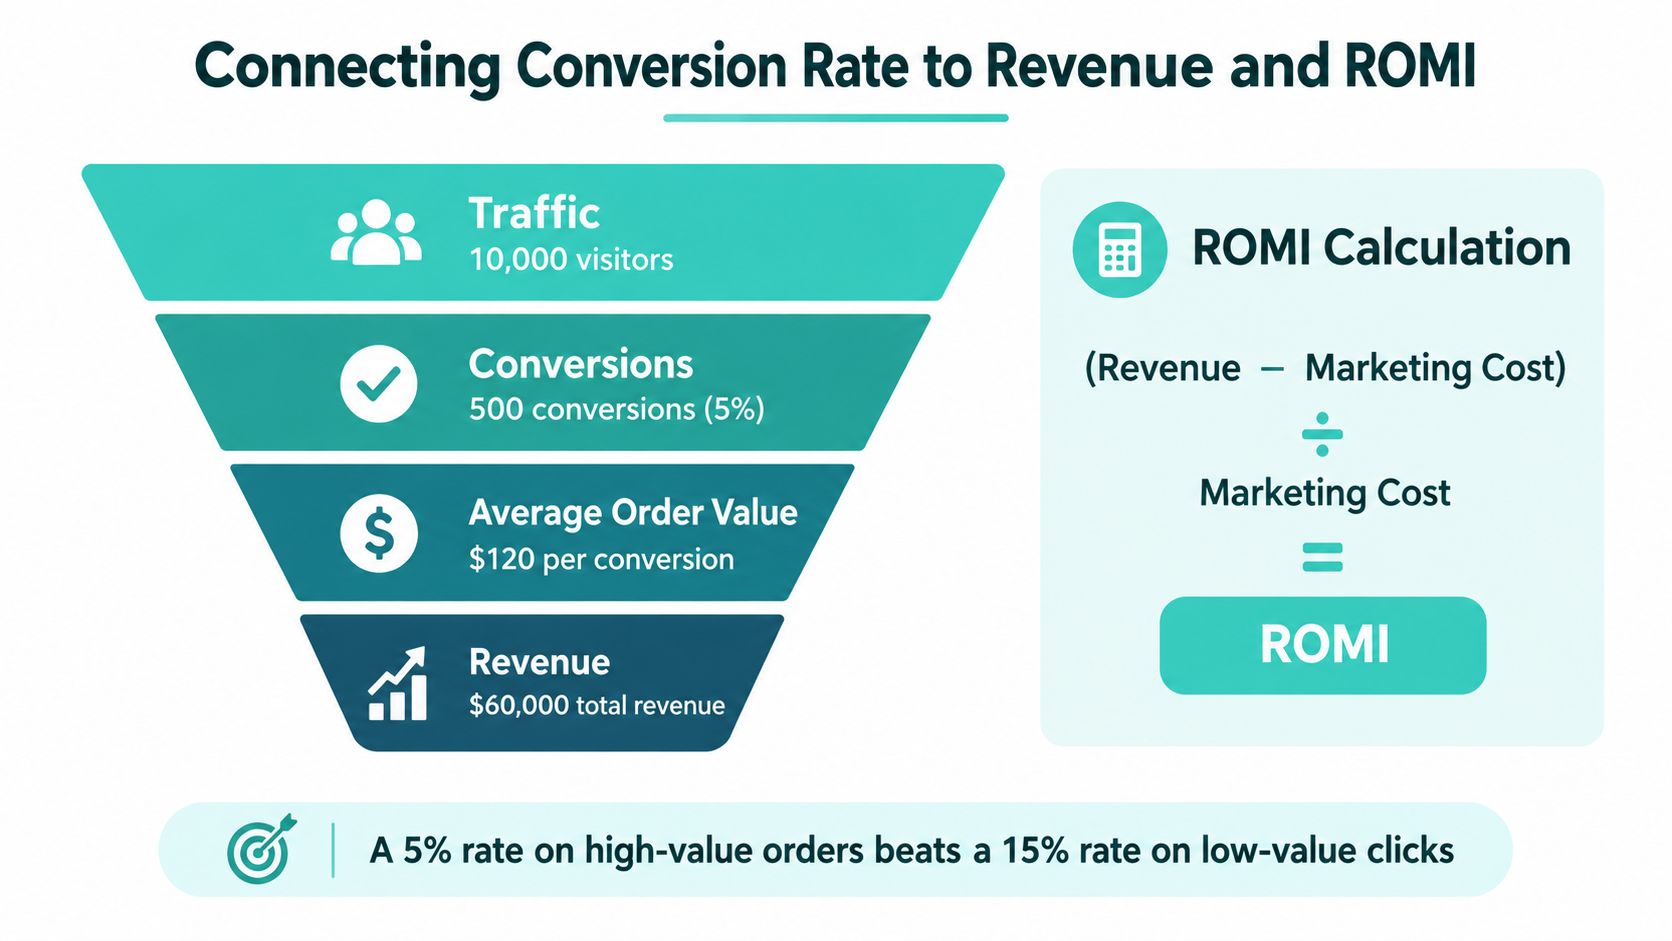
A high conversion rate can still be a poor business result if the action is cheap, low-quality, or disconnected from revenue. A modest rate can outperform it if the conversions are qualified and move into sales.
Build the ladder from inquiry to client
The smartest way to read conversion rate is as a ladder. Start with visitor to inquiry, then inquiry to qualified lead, then qualified lead to consultation, then consultation to client. The earlier steps matter, but they don't all carry the same revenue weight.
Here's the practical problem. A campaign can generate a lot of inquiries and still underperform if most of them never become consultations. Another campaign can produce fewer inquiries, but if those inquiries are better qualified and easier to close, it can contribute more revenue.
| Funnel Step | Example Rate | Revenue Impact |
|---|---|---|
| Visitor to inquiry | Entry point metric | Shows demand capture |
| Inquiry to qualified lead | Quality filter | Removes weak leads |
| Qualified lead to consultation | Sales readiness | Predicts pipeline strength |
| Consultation to client | Final business outcome | Ties directly to revenue |
Why ROMI needs more than one number
ROMI is where the ladder becomes meaningful. If you're tracking revenue against marketing cost, the relationship is simpler when the funnel is clean and the lead quality rules are clear. The calculation itself is straightforward, (Revenue − Marketing Cost) ÷ Marketing Cost = ROMI, but the inputs only make sense when the conversions are the right ones.
A law firm is a good example. If one campaign generates many form fills from people who never answer the phone, the headline conversion rate may look impressive while the revenue result stays weak. If another campaign creates fewer but more qualified consultation requests, the lower rate may still support better ROMI.
Don't optimize for the easiest click if the easy click doesn't turn into revenue.
If you want a practical tool for thinking through that tradeoff, SimpleLab Digital's ROMI calculator fits this exact question. It's useful because it pushes the discussion beyond surface metrics and back toward business outcomes.
A Practical Reporting Checklist Before You Trust the Number
A conversion rate is only safe to use when the report answers a few basic questions first. If it doesn't, the percentage can lead you in the wrong direction.
Check the four fields that matter most
- Conversion event: Name the action clearly. A consultation booking is not the same as a button click.
- Denominator: Decide whether you're measuring users, sessions, clicks, or another eligible group.
- Attribution window: State when the conversion is counted and how long credit is kept.
- Deduplication rule: Make sure repeat form submits or duplicate calls aren't counted as extra customers.
Those four items stop the most common reporting mistakes. They also make it easier to compare one report with another without guessing what changed.
Add the context that changes the verdict
- Traffic source: Paid search, organic search, email, and social rarely behave the same.
- Device: Mobile and desktop should be checked separately when performance looks off.
- Reporting period: A weekly view can look very different from a monthly one, especially during campaign launches or seasonal swings.
- Lead quality rule: Define what counts as a real lead, not just an interaction.
If you're reporting for a service business, one inquiry should generally count once per defined session or lead, not every time the same person refreshes the page or clicks again. That's the difference between measuring demand and inflating a dashboard.
For teams working on client acquisition, how to measure law firm marketing ROI is a useful next read because it connects reporting discipline to business value. It also makes clear why surface activity isn't enough on its own.
Quick test: if you can't explain the denominator in one sentence, the rate isn't ready for a decision.
That rule saves a lot of bad meetings. It also keeps the conversation focused on what the number means, not just how large it looks.
Key Takeaways and What to Do Next
The easiest way to misuse conversion rate is to treat it like one fixed truth. A better read starts by labeling the measurement, then confirming the action, the denominator, the attribution window, and the lead-quality rules behind it.
Start with the event, not the percentage. Separate micro conversions from macro conversions so early interest does not get mistaken for revenue. Then compare the number by device, audience, and traffic source before using any benchmark. That keeps you from rewarding the wrong behavior.
The full ladder matters too. A form fill matters because it feeds the next step. A qualified lead matters because it changes the sales conversation. A consultation matters because it moves closer to revenue. Each stage gives the next one context.
Open your current dashboard and apply the checklist to one campaign, one landing page for law firm consultations, or one lead source. Ask what the conversion event is, what the denominator is, and whether the number reflects a real business outcome.
That chain turns a bare percentage into a diagnostic you can act on.