ROI = (attributed revenue minus marketing cost) divided by marketing cost, multiplied by 100. A $10,000 campaign producing $30,000 in attributed revenue returns $20,000 net after marketing costs, giving you a 200% ROI.
Your advertising dashboard looks encouraging, but your bank balance hasn't caught up. Leads are coming in, your agency reports conversions, and you're trying to decide whether another month of spending makes sense.
The arithmetic isn't the hard part. Learning how to calculate marketing return on investment means deciding which revenue belongs to marketing, which expenses belong in the investment, and how long customers need to become profitable. Those decisions can turn an impressive headline into a much more cautious budget recommendation.
Table of Contents
The Marketing ROI Formula With a Worked Example
ROI = (attributed revenue − marketing cost) ÷ marketing cost × 100.
The formula is short. The judgement sits in the inputs: which revenue counts, which costs count, and over what period. Nielsen's ROI report frames the calculation as return on the full investment, a wider question than media efficiency on its own.
Assume a campaign produced $30,000 in attributed revenue against $10,000 in total marketing costs. Subtracting the investment leaves $20,000, or $2 in net return for every $1 invested, before any delivery costs still sitting outside the sheet.
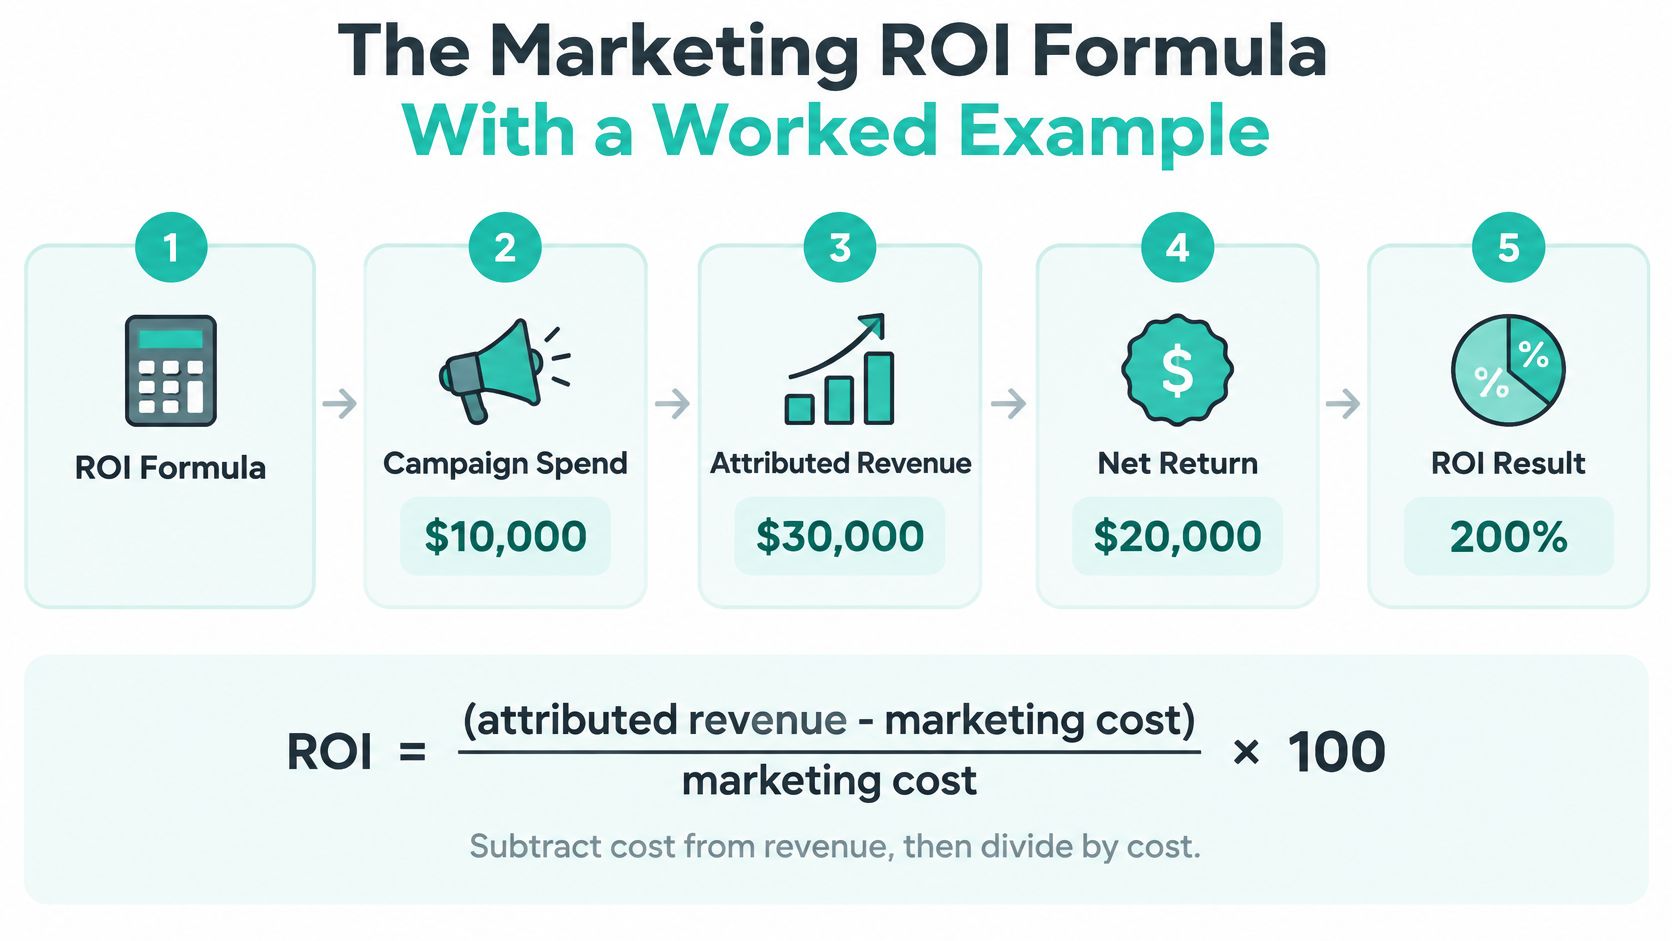
Work through the calculation
- Choose the scope. Pick one campaign or channel and a fixed spending period, so revenue and costs describe the same activity.
- Total the investment. Combine every relevant marketing expense using actual charges, never the approved budget.
- Pull attributed revenue. Apply a stated attribution rule to completed business outcomes. A dashboard conversion isn't automatically a sale.
- Subtract the investment. Revenue minus cost gives a revenue-based net return; it becomes accounting profit only after fulfillment costs are included.
- Divide by marketing cost. Expressing return relative to spend makes campaigns of different sizes comparable.
- Multiply by 100 and label it. Record the attribution model, cost scope, revenue definition and measurement window next to the percentage.
Worked example for a $10,000 campaign
| Step | Calculation | Result |
|---|---|---|
| Total marketing cost | Media, agency, creative and landing page | $10,000 |
| Attributed revenue | Revenue under the stated model | $30,000 |
| Net return | $30,000 minus $10,000 | $20,000 |
| ROI | ($30,000 − $10,000) ÷ $10,000 × 100 | 200% |
| ROAS | $30,000 divided by $10,000 | 3.0 |
ROAS divides revenue by advertising spend alone. The table's 3.0 reuses the $10,000 denominator to contrast revenue over investment with net return over investment; where media is only part of the total cost, calculate platform ROAS separately.
Read the result before acting
On this formula, 0% means revenue covered the costs you included. 100% means revenue is double the investment. A negative figure means attributed revenue fell short of those costs.
Treat 200% as a first pass. Add $5,000 of follow-up time and tools you left off the sheet, and ROI drops to 100%. Find that $12,000 of the attributed revenue would have arrived without the campaign, and ROI on the remaining $18,000 is 80%. Apply both corrections together and the same campaign returns 20%.
Revenue break-even also differs from business break-even, because gross margin decides the threshold. Our guide to calculating break-even ROAS works through that adjustment.
Shopify sellers can check the same arithmetic against a profitability guide for Shopify merchants. Plug your own figures into the table, then compare the result with the ROAS you already report.
Which Costs and Revenue to Count
An understated cost base can make an ordinary campaign look exceptional. The fix isn't a more advanced dashboard. It's a complete expense sheet with clear allocation rules.
Count the work required to attract, convert, and handle the opportunity. An employee's time isn't free because it doesn't appear on an agency invoice, and a landing page doesn't disappear from the investment because another department paid for it.
Build a complete input sheet
The following figures are hypothetical planning inputs, not market prices or recommended benchmarks.
Cost and revenue inputs for the ROI calculation
| Input | Count it? | Sample figure | Common error |
|---|---|---|---|
| Agency or management fees | Yes | Campaign share of the management invoice | Left out because it is billed separately |
| Ad spend | Yes | Actual platform charges | Using clicks-based budget instead of actual spend |
| Creative production | Yes | $800 per campaign | Ignored because it was made in house |
| Landing page work | Yes | Allocated design and development cost | Charged to a different budget |
| Software and tools | Yes | $200 per month | Shared across channels without allocation |
| Sales follow-up time | Yes | 10 hours per month | Not costed at all |
| Gross margin on revenue | Yes | 40% of sales | Counting revenue as profit |
| Refunds and cancellations | Yes | 5% of sales | Not deducted |
| Lead quality and close rate | Yes | 20% close rate | Every inquiry counted as equal |
Allocate shared tools and reusable creative consistently. You can spread a reusable asset across the campaigns that benefit, but document the rule before comparing results.
Practical rule: A missing expense row matters more than an extra decimal place in the ROI percentage.
Separate sales value from contribution
Say a sale produces $30,000 in revenue at a hypothetical 40% gross margin. That leaves $12,000 before marketing costs, not $30,000 available to repay the campaign. Use contribution after relevant delivery expenses as the numerator's return input when assessing profitability, and don't subtract those expenses again.
For a law firm, a hypothetical $1,500 paid consultation is consultation revenue only if earned. It isn't the value of a retained matter, and an unsigned inquiry isn't collected revenue.
Use lead quality and close rate to estimate pipeline value, then replace estimates with actual receipts as matters close. Keep projected lifetime value separate from realized revenue, and account for discounts, refunds, and cancellations without deducting them twice.
Our small-business marketing budget guide helps organize spending before you allocate it. Build the one-page cost sheet before running the formula.
Choosing an Attribution Model That Fits Your Pipeline
The same sale can produce different channel-level ROI under different attribution rules. Attribution assigns conversion credit to the ads, clicks, and other interactions in a customer's path; it doesn't change the amount your business sold.
Google's attribution documentation describes rules-based approaches including linear credit, time decay with a 7-day half-life, and position-based credit assigning 40% to the first interaction, 40% to the last, and 20% to the middle. Under that time-decay rule, a click eight days before conversion receives half the credit of a click one day before conversion.
Compare the rules with your sales process
Attribution models and when each fits
| Model | How credit is split | Best when |
|---|---|---|
| Last click | 100% to the final click | Short, direct-response sales with few touchpoints |
| First click | 100% to the first interaction | Measuring which channel creates new awareness |
| Linear | Equal credit to every click | Multi-touch journeys where each step matters |
| Time decay | More credit to clicks closer to the sale, 7-day half-life | Short sales cycles where recent clicks drive closing |
| Position-based | 40% first, 40% last, 20% middle | Balancing discovery and closing for longer journeys |
| Data-driven | Credit modeled from observed conversion paths | Enough conversion volume to support reliable modeling |
These are comparison frameworks, not a promise that every model is selectable in your current software. Google's conversion-reporting documentation identifies data-driven attribution as the default supported model, with last click another supported option.
For a short buying journey, last click provides a straightforward operational view. For a lengthy legal consultation process, I'd pair the available attribution model with a CRM journey report showing discovery, consultation, and retention rather than allowing the closing click to represent the whole relationship.
Keep the reporting rule stable
A prospective client might discover you through educational content, return through a search ad, and finally book after an email. Switching models can redistribute that client's revenue among channels without creating additional business.
Use one primary model for routine reporting and a sensitivity view to reveal whether a channel's apparent profitability depends heavily on the rule. Google's model-comparison guidance supports comparing attributed values under different models rather than accepting an unexplained percentage.
For marketplace advertisers, agentcentral's guide to interpreting ACOS and ROAS through attribution offers a related perspective. Our Google Ads management scope and metrics guide helps distinguish campaign reporting from the management work you're paying for.
Recommended reporting rule: Keep the model consistent, document changes, and never interpret a redistribution of credit as sales growth.
Attributed ROI Versus Incremental Lift
Your headline ROI may be taking credit that marketing didn't earn. An ad platform can associate a sale with an interaction even when the customer would've purchased without the ad.
The distinction matters whenever a dashboard presents attributed performance as additional business.

The IAB and IAB Europe incremental measurement guidelines distinguish attribution, which describes outcomes associated with exposure, from incrementality, which estimates outcomes that wouldn't have occurred without marketing. Their framework recognizes experiments, modeled counterfactuals, econometrics, and hybrid approaches as different forms of causal evidence.
For a law firm, a referred prospect might search the firm's name and click a paid listing before calling. The campaign may receive conversion credit, but the referral could have generated the engagement anyway. Separate branded search, non-branded discovery, referrals, and direct inquiries so this overlap is visible.
Match the evidence to the decision
Measurement methods and the evidence they provide
| Method | Evidence strength | What it requires | Best for |
|---|---|---|---|
| Platform-reported attribution | Low causal weight | Standard tracking | Everyday channel reporting |
| Modeled counterfactual | Moderate | Historical data and a model | Channels that cannot be split into tests |
| Geo holdout | Strong when well designed | Comparable regions, with advertising withheld in one | Multi-location businesses such as clinics or law firms |
| Randomized holdout | Strongest when well executed | Audience split and enough volume | Larger budgets with stable conversion volume |
| Offline revenue reconciliation | Supporting check | CRM or sales ledger | Validating any attributed figure |
This is a practical evidence ladder, not an automatic ranking of every implementation. A poorly matched geographic comparison can be less useful than a carefully validated model.
For additional context on measurement, use the video alongside your own campaign and revenue reports.
A workable route for smaller budgets
Start by labeling the result attributed ROI unless a credible test supports a causal claim. Track organic and assisted conversions separately, while deduplicating customers in the business-level revenue total.
If you serve comparable areas, consider advertising in one while withholding the campaign in another. Check service mix, seasonality, baseline demand, and capacity before interpreting the difference as lift.
Review attributed results against offline revenue each quarter, but recognize the limit: reconciliation verifies sales, not causation. Before increasing a budget, write down the evidence supporting the return and what could invalidate the estimate.
Measuring Delayed Revenue With Cohort Windows
Say a January campaign generates an inquiry that becomes a February consultation and a March signed engagement. A January-only report captures the expense but misses the later return; a March-only report may show revenue without its acquisition cost.
A cohort groups leads by when they entered your pipeline. Keep following that group instead of treating each calendar month's spending and receipts as a matched pair.
The timeline makes that mismatch visible.

Follow the lead through the business
Give the January inquiry a unique form or call identifier and preserve its campaign information in your CRM. When someone confirms service fit, move it to qualified opportunity; after the February meeting, record consultation.
In March, distinguish retained client from collected revenue. A signed engagement establishes a commitment, but only an actual receipt belongs in the cash-collected column. Continue recording customer value as subsequent work or renewals occur.
Import revenue against that same record rather than creating disconnected conversion entries. Keep advertising, agency labor, staff handling, software, production, discounts, refunds, and fulfillment in the appropriate cost or revenue fields.
Give each reporting window a job
The following are practical review windows, not promises about how quickly your business should convert.
| Cohort window | Track | Decision it supports |
|---|---|---|
| 30 days | Qualified inquiries, early consultations, booked revenue | Are the leads usable and progressing? |
| 90 days | Retained clients, collected revenue, first renewals where applicable | Does the channel justify continued funding? |
| 180 days | Realized repeat revenue and updated lifetime-value estimates | Does longer-term contribution justify allocation? |
Keep booked revenue and collected revenue in separate columns at every checkpoint. Also separate realized repeat sales from projected lifetime value, particularly when the cohort hasn't matured.
In a hypothetical subscription scenario, acquisition spending makes the opening month unprofitable, but renewals produce positive ROI by month six. That's a reason to evaluate both payback timing and eventual contribution, not a reason to assume renewals will occur.
Measurement systems don't automatically solve these issues. MarTech's coverage of the IAB/BWG Global State of Data 2026 report says 75% of marketers surveyed reported that their measurement approaches weren't delivering the speed, accuracy, or trust they needed.
Our customer retention playbook offers ways to support repeat business rather than merely forecast it. Reconcile each cohort's attributed pipeline against cash collected every month.
Common Mistakes That Inflate Marketing ROI
Counting form fills or platform conversions as revenue is the most consequential reporting shortcut. A person requesting information hasn't necessarily qualified, purchased, or paid.
Attach forecast values to leads only when they're clearly labeled as estimates. For financial reporting, use the actual outcome and keep duplicate inquiries from becoming duplicate customers.
The graphic summarizes the reporting errors to check first.

Fix the inputs before optimizing the campaign
- Missing labor, tools, or management fees. Reconcile the campaign expense sheet against invoices, subscriptions, and staff time. Don't optimize around a denominator you know is incomplete.
- Unlabeled last-click reporting. Put the attribution model beside the result. A reader shouldn't have to infer what received credit.
- Booked and collected revenue mixed together. Maintain separate fields so unpaid commitments don't conceal cash-flow pressure.
- Different cohort ages compared as equals. Match the observation windows before deciding which campaign deserves more funding.
- Branded and non-branded demand combined. Review them separately before deciding whether paid search is creating opportunities or mainly capturing existing demand.
- Brand effects ignored. Monitor branded searches and assisted conversions alongside financial returns, without inventing revenue values for them.
A dashboard can be internally consistent and still answer the wrong business question.
Understand what the headline leaves out
Nielsen's full-funnel ROI guidance reported that only 54% of global marketers were confident measuring full-funnel ROI and that nearly 40% of digital advertising budgets were reaching the wrong audiences. In its study covering 15 brands and 82 U.S. digital campaigns, less effective target-audience delivery averaged $0.25 returned per $1 spent, compared with $2.60 for stronger delivery.
The same Nielsen guidance found that a one-point gain in brand metrics, such as awareness or consideration, corresponded on average to a 1% increase in sales. That finding supports monitoring longer-term effects, not adding an assumed brand uplift to your spreadsheet.
These are measurement and audience-delivery findings, not a target ROI for your business. Use them as a reason to inspect qualification and targeting before blaming creative or raising spend.
At month-end, match attributed revenue to the sales ledger. Investigate unmatched transactions, duplicate records, reversed payments, and missing campaign identifiers before approving the report.
Run Your First ROMI Check This Month
Start with a report you can finish and defend. You don't need to solve every attribution problem before making your next budget decision, but you do need consistent definitions and a visible list of uncertainties.
Use the latest completed quarter as your starting point. Keep the initial review narrow enough that someone can trace every major cost and revenue entry.
Complete the first pass this week
- Pull total marketing spending. Include agency fees, production, media, tools, and allocated internal work. Reconcile the total with your accounts.
- Export CRM revenue. Separate booked business from collected payments, and preserve the original inquiry date so delayed sales remain attached to their acquisition cohort.
- Choose and record the attribution model. State the conversion window and how you handle direct calls, referrals, and repeat customers.
- Calculate channel ROI and ROAS. Use contribution-adjusted return for profitability decisions and advertising-only spend for ROAS. Keep the denominators explicit.
- Label the evidence. Identify which results are attributed estimates and which have credible experimental support. Flag immature cohorts instead of treating their early results as final.
Don't immediately cut everything with a lower reported return. Check whether the channel creates discovery, supports later conversions, or has younger leads.
Our guide to finding your vital marketing activities with the 80/20 rule can help prioritize the next investigation. Choose a specific action, such as improving qualification, repairing revenue tracking, or testing a budget change, and assign an owner.
Use scenarios to plan the next investment
SimpleLab Digital's ROMI calculator lets you choose a practice area, services, and budget, then compare scenarios showing total investment, estimated extra revenue, and when it could pay off. It requires no email to use, and its estimates aren't guarantees.
Take the scenario, cost sheet, and revenue export to a Marketing Guru for review. Readers considering digital marketing for small businesses or digital marketing for lawyers should assess the relevant service and practice-area information against those assumptions, not choose a campaign solely because a calculator displays an attractive return.
The useful outcome is a budget you can explain: what you're investing, which business results would justify it, and when you'll have enough evidence to decide.
SimpleLab Digital plans, builds, and manages connected ads, content, landing pages, and follow-up for small businesses and law firms. Visit SimpleLab Digital to explore a ROMI scenario and review it with a Marketing Guru, using your actual costs, margins, and sales timeline to shape the plan.